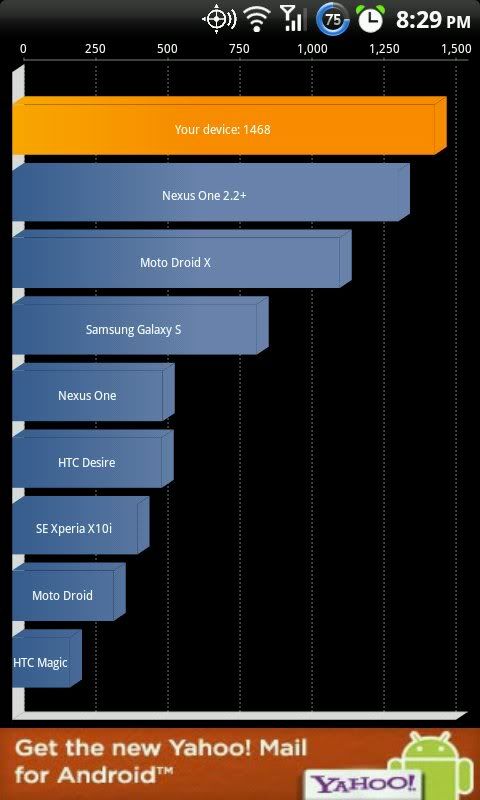
I can not help but notice that even on a stock kernel and 2.2 not overclocked, you can get super groovy high scores, as long as you run a score and then run another score- without killing the app after each test.
The scores trend up and then peak, but I think the scores are biased. If you want a more accurate score, run at least three tests, but each time, start fresh by exiting the app and killing with an app killer.
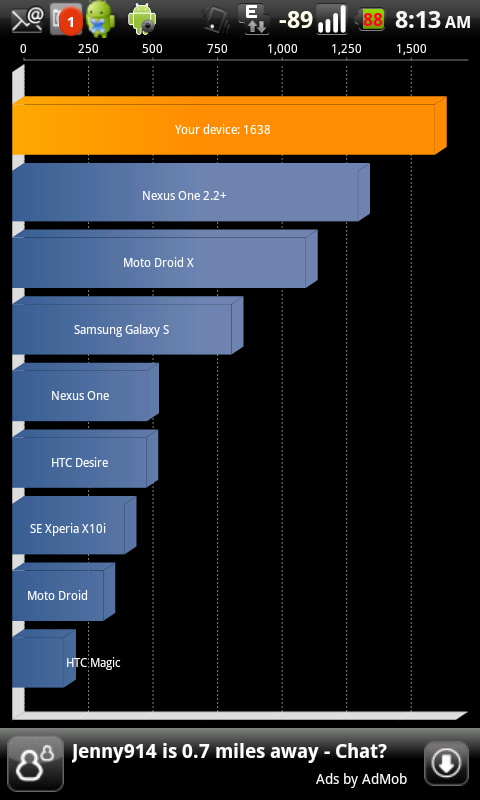
The scores some people are posting have no correlation to any apparent standard, in regards to kernels, OS bake or methods. Using rooted 2.2 Lite and BFS kernel non OC'd, I was able to get 1490, as long as I ran concurrent tests WITHOUT starting fresh.
All with 2.15 radio and all with no overclock:
Example with rooted stock 2.2 and Sky 2.52 with stock kernel (virtually no difference with OS bakes)
Running concurrent tests = 1300 average, 1370 peak
Running fresh each time = 1175 average, 1200 peak
Example with rooted stock 2.2 and BFS kernel
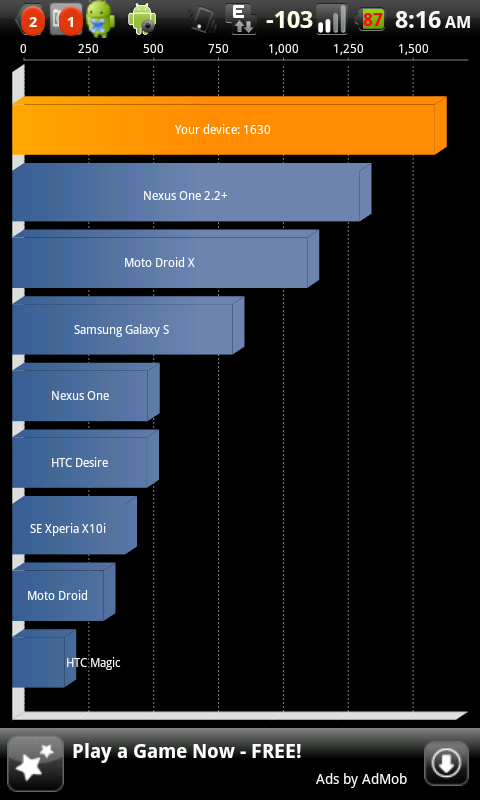
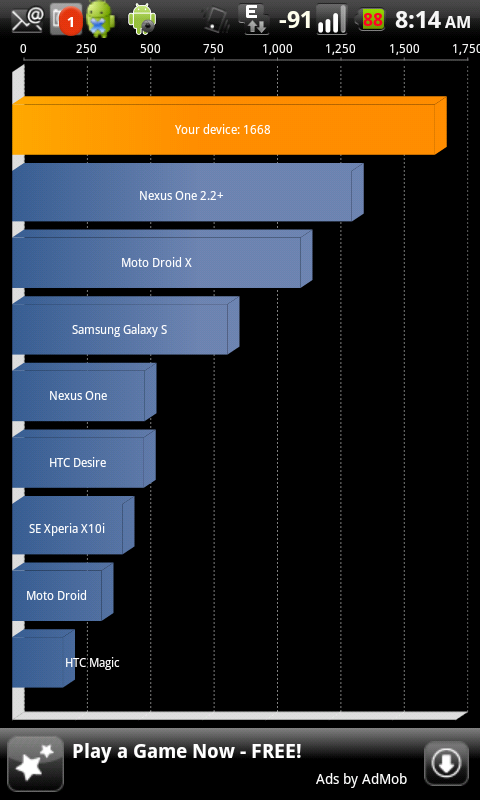
Running concurrent tests = 1370 average, 1490 peak
Running fresh each time = 1233 average, 1260 peak
Conclusion is running concurrent tests equal bad numbers and this assumes even that parameters of Quadrant are basing on pure results of tests and not a bias to a specific software or hardware configuration- for the "good" numbers.
added:
There reason I became a tad suspect is that overclocking tends to have a (basically) linear relationship to operations and then hits a ceiling with diminishing returns after the ceiling (propagation and heat).
The big test result numbers being posted have an exponential relationship to the clock. This would be odd, unless the Snap has some new "adaptive exponential curve technology"")
")
added 2:
Throw in Setcpu and you have a whole set of new problems to get a real number, since the governor options (on demand, conventional, etc) will also bias the results due to timing of how the clock/Snap is managed and polls. Quadrant can not account for this (it would have no way to, unless parameter tables were created to do so).
The scores trend up and then peak, but I think the scores are biased. If you want a more accurate score, run at least three tests, but each time, start fresh by exiting the app and killing with an app killer.
The scores some people are posting have no correlation to any apparent standard, in regards to kernels, OS bake or methods. Using rooted 2.2 Lite and BFS kernel non OC'd, I was able to get 1490, as long as I ran concurrent tests WITHOUT starting fresh.
All with 2.15 radio and all with no overclock:
Example with rooted stock 2.2 and Sky 2.52 with stock kernel (virtually no difference with OS bakes)
Running concurrent tests = 1300 average, 1370 peak
Running fresh each time = 1175 average, 1200 peak
Example with rooted stock 2.2 and BFS kernel
Running concurrent tests = 1370 average, 1490 peak
Running fresh each time = 1233 average, 1260 peak
Conclusion is running concurrent tests equal bad numbers and this assumes even that parameters of Quadrant are basing on pure results of tests and not a bias to a specific software or hardware configuration- for the "good" numbers.
added:
There reason I became a tad suspect is that overclocking tends to have a (basically) linear relationship to operations and then hits a ceiling with diminishing returns after the ceiling (propagation and heat).
The big test result numbers being posted have an exponential relationship to the clock. This would be odd, unless the Snap has some new "adaptive exponential curve technology"
added 2:
Throw in Setcpu and you have a whole set of new problems to get a real number, since the governor options (on demand, conventional, etc) will also bias the results due to timing of how the clock/Snap is managed and polls. Quadrant can not account for this (it would have no way to, unless parameter tables were created to do so).