• After 15+ years, we've made a big change: Android Forums is now Early Bird Club. Learn more here.

Root Quadrant scores probably a misnomer- depending on how you test

rushmore

Extreme Android User
Nov 13, 2008
8,256
1,355
Kentucky
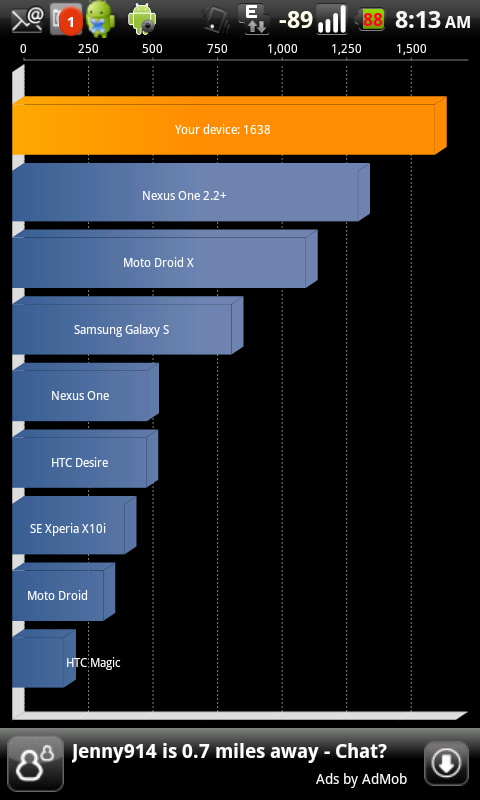
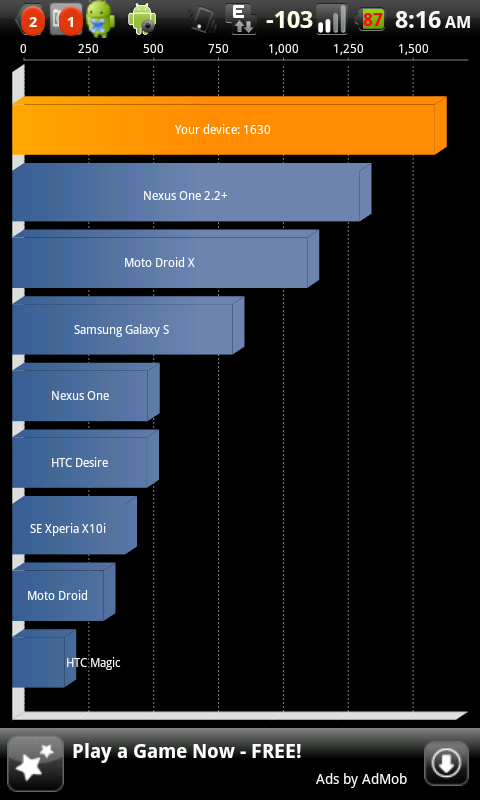
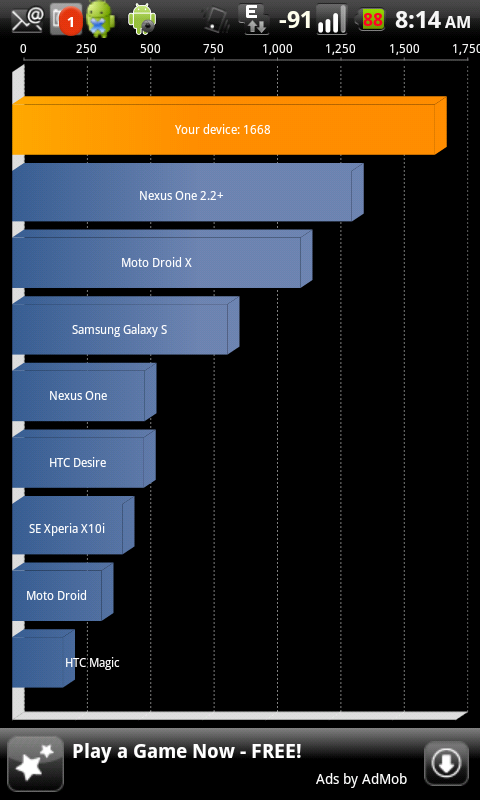
I can not help but notice that even on a stock kernel and 2.2 not overclocked, you can get super groovy high scores, as long as you run a score and then run another score- without killing the app after each test.

The scores trend up and then peak, but I think the scores are biased. If you want a more accurate score, run at least three tests, but each time, start fresh by exiting the app and killing with an app killer.

The scores some people are posting have no correlation to any apparent standard, in regards to kernels, OS bake or methods. Using rooted 2.2 Lite and BFS kernel non OC'd, I was able to get 1490, as long as I ran concurrent tests WITHOUT starting fresh.

All with 2.15 radio and all with no overclock:

Example with rooted stock 2.2 and Sky 2.52 with stock kernel (virtually no difference with OS bakes)

Running concurrent tests = 1300 average, 1370 peak
Running fresh each time = 1175 average, 1200 peak

Example with rooted stock 2.2 and BFS kernel

Running concurrent tests = 1370 average, 1490 peak
Running fresh each time = 1233 average, 1260 peak

Conclusion is running concurrent tests equal bad numbers and this assumes even that parameters of Quadrant are basing on pure results of tests and not a bias to a specific software or hardware configuration- for the "good" numbers.

added:

There reason I became a tad suspect is that overclocking tends to have a (basically) linear relationship to operations and then hits a ceiling with diminishing returns after the ceiling (propagation and heat).

The big test result numbers being posted have an exponential relationship to the clock. This would be odd, unless the Snap has some new "adaptive exponential curve technology" ;) :)

added 2:

Throw in Setcpu and you have a whole set of new problems to get a real number, since the governor options (on demand, conventional, etc) will also bias the results due to timing of how the clock/Snap is managed and polls. Quadrant can not account for this (it would have no way to, unless parameter tables were created to do so).
 
why would running concurrent tests give bad numbers? isn't it possible the processor could be scaling up based on the demand?

yesterday i installed the ruu and ran quandrant three times in a row. my scores were 1140, 1260, 1344.

just ran it again from scratch while typing this post and my score is 1215.

edit - i'm rooted (went through the root process immediately before installing the ruu, and i've never loaded any other rom other than the stock) but everything (kernel and rom) is mostly stock. only thing i did was manually remove some bloatware.
 
Upvote 0
why would running concurrent tests give bad numbers? isn't it possible the processor could be scaling up based on the demand?

yesterday i installed the ruu and ran quandrant three times in a row. my scores were 1140, 1260, 1344.

just ran it again from scratch while typing this post and my score is 1215.

edit - i'm rooted (went through the root process immediately before installing the ruu, and i've never loaded any other rom other than the stock) but everything (kernel and rom) is mostly stock. only thing i did was manually remove some bloatware.

The CPU should be running full tilt when benchmarking, so theres no scaling up to do. Unless there is a cache being created for the program, I can't think of a way the score would naturally and truly improve without killing the app. I will look into more in a bit: Currently using my phone for internet access, which would offset my results:)
 
Upvote 0
Scale up should be in micro or worst case milliseconds, so as soon as you activate the app. The time phase difference between the steps in clock and voltage is nominal when going from conservative to demand profiles.

There must be some kind of cache or stack bias coming into play. Concurrent tests will show far higher numbers and do not appear to scale logically with the small marginal clock increase Snapdragon has for its ceiling. An exponential relationship: (10% to 15% increase in clock) and (37% increases in Quadrant) is not logical. In my respectful opinion, concurrent average tests = placebo.


added:

Most accurate average will be derived by fresh tests each time (IMO).
 
Upvote 0
There may be something to the comments about caching. Not sure it's a placebo, but I see how it could skew the results.

For discussions sake, wouldn't caching also happen with other apps thereby improving their performance as well?

Various forms of caching are very common for programs, but this is generally up to app designers. There are also various types of processor caching. In fact, most modern CPUs have a dedicated portion for caching. It's been so long since I built my comp I've managed to forget exactly which CPU I put in it, lol, but I believe it has 64kb in cache.

My point being, theres a huge number of different types of caches and if/when/how they are implemented. Some have to be coded into the program, some are added during compile, others run time, etc.

Back to the Quadrant scores.

I have ran some more tests, and I found that A) Yes, if you run Quadrant once, then immediately run it again, your score takes a nice jump. B) This increase does NOT continue after the second run. ( In fact, half the time my scores dropped slightly on the 3rd run...though all within normal variance. )

I think it is fine, possibly even best, to simply run Quadrant about 5 times back to back, and just ignore the first one. This removes the tedium of killing the process and restarting each time.

Yes, your avg score will be higher....but benchmarks are ONLY useful for comparing one score in the benchmark directly to another score under identical situations. As such: Anyone you are comparing to, should also be doing multiple runs and ignoring the first: Thus, they should be benefiting equally.

NOTE: Benchmarks are extremely artificial. As has been mentioned, people have found various ways to "game" or cheat the system. Also, some things may score really well, and yet fail to live up to those. ( An example in many ways is the DX. Technically, by the books and through benchmarks...the X is faster. Yet, if you hand the 2 phones to most people without telling them this, they will think the Inc is faster.) The real world often makes things far more complicated:) The morale is: Don't take a benchmark score as law. Take it with a grain of salt.
 
Upvote 0
All points are very reasonable, but the key point seems it would be highly unlikely for a 10% to 15% percent increase in clock to equal a 37% increase in operational output.

I think there are too many unknowns about the app to treat results as trusted results at a granular level. Perhaps as a general direction, but not by any exact margin of difference.

I wish Futuremark would make an Android benchmark:) I've always liked their stuff.

I really have no idea either why the scores would increase in such a way from overclocking. Did this occur in 2.1 as well? If not, when combined with the 2.2 JIT could it be having a more multiplicative effect instead of additive?

Perhaps the base code for the benchmark itself is statistically relevant? By which I mean, it is taking a noticeable percentage of processing for the base code where it handles/records all the data from the benchmark. This could cause a large leap in performance from a small increase in the actual speed. Yes...it would still be linear: but it would be greater than the increase in the clock speed.
 
Upvote 0
I wish Futuremark would make an Android benchmark:) I've always liked their stuff.

I really have no idea either why the scores would increase in such a way from overclocking. Did this occur in 2.1 as well? If not, when combined with the 2.2 JIT could it be having a more multiplicative effect instead of additive?

Perhaps the base code for the benchmark itself is statistically relevant? By which I mean, it is taking a noticeable percentage of processing for the base code where it handles/records all the data from the benchmark. This could cause a large leap in performance from a small increase in the actual speed. Yes...it would still be linear: but it would be greater than the increase in the clock speed.


Yes, 2.1 did the same thing, but a lot smaller numbers, of course. New Dalvik layer is not the resource hog it once was :) Still, a more efficient layer would not result in an exponential relationship due to clock increases.

I guess if a person believes their scores are correct and they are happy with
the performance, no harm, no foul anyways :)

None the less, far too much variability and combinations to treat any results as scientific record ;)
 
Upvote 0
Yes, 2.1 did the same thing, but a lot smaller numbers, of course. New Dalvik layer is not the resource hog it once was :) Still, a more efficient layer would not result in an exponential relationship due to clock increases.

I guess if a person believes their scores are correct and they are happy with
the performance, no harm, no foul anyways :)

None the less, far too much variability and combinations to treat any results as scientific record ;)

It would really be great if we could see the individual scores for each section in Quadrant. Then at least we could figure out where all of the variance is coming from. Is it CPU related, Video, 3d, textures, I/O...really theres so much left wanting from quadrant, but it's the best benchmark I've heard of so far. Others seem to have even greater variance on a test by test basis:(
 
Upvote 0
zemerick said:
The morale is: Don't take a benchmark score as law. Take it with a grain of salt

Agreed. Benchs are good for measuring raw capability, but aren't always an indicator of real world user experience.

Knowing that there is an overall improvement with froyo it only makes sense that we try to measure it. I suppose this how we got to the benchmarking part. :)
 
Upvote 0
It would really be great if we could see the individual scores for each section in Quadrant. Then at least we could figure out where all of the variance is coming from. Is it CPU related, Video, 3d, textures, I/O...really theres so much left wanting from quadrant, but it's the best benchmark I've heard of so far. Others seem to have even greater variance on a test by test basis:(

Agreed on separate / specific item scores and what weight is applied for a final aggregate score.
 
Upvote 0
It would really be great if we could see the individual scores for each section in Quadrant. Then at least we could figure out where all of the variance is coming from. Is it CPU related, Video, 3d, textures, I/O...really theres so much left wanting from quadrant, but it's the best benchmark I've heard of so far. Others seem to have even greater variance on a test by test basis:(

Like this? :D

4llg2e.jpg

For what it's worth, I ran it 3 times and got 1601, 1599, and 1612. This is with Adrynalyne's Fourth Wave ROM w/King Kernel BFS #1. Set at 1113Mhz on the interactive governor.

For whatever reason it's not available on the Android Market, but is on SlideMe. Quadrant Advanced | SlideME

It's really so much more useful than the regular quadrant to see how scores are put together. You can see that almost all of the gain from froyo is CPU. ;) You can see how some phones like the Droid X (moto shadow X) have a crazy I/O that boosts their total score, over something like the galaxy, that has better CPU and way better 3d performance. A lot of people have done a similar exploit with the I/O to boost their scores. My friend with an EVO just sent me a score of 2200, and his I/O was 3500, lol. One thing I find really interesting is that I get much higher 3d scores on CM6, and not just in quadrant. My neocore was over 30fps on CM6. My friends EVO gets higher 3d scores than me consistently too, he says it's something to do with their custom kernels allocating extra RAM to the GPU.

It just seems it's a straight average of all the individual scores added together. I'm not sure how each score is determined on it's own though.

I really don't agree that running the test repeatedly gives a "bad" score. I can see for myself on different kernels or governors that the CPU score slowly increases as you run the tests over and over. Depending on the scaling governor, you'll see a different trend.

I left mine on the interactive scaler, but I would recommend putting it in performance for benchmarks, depending on the governor, your CPU may not be at max speed the entire time and would produce a score that's not entirely accurate of what it should be imo. There are variances between ROM's and kernels depending on what people do with them, as it should be, depending on other things such VM size, scheduler types, memory allocations, or any other optimizations they might make. Looking at just the final score doesn't give much insight into any of that though.
 
Upvote 0
All points are very reasonable, but the key point seems it would be highly unlikely for a 10% to 15% percent increase in clock to equal a 37% increase in operational output.

I think there are too many unknowns about the app to treat results as trusted results at a granular level. Perhaps as a general direction, but not by any exact margin of difference.

I agree. Just looking at the frame rates on Quadrant leads me to believe there's some trickery going on. Frame rates are nearly the exact same. Nenamark also shows no increase and is entirely 3D benchmarking. I'm not sure where we're seeing gains on Quadrant, but it's not in the 3D arena.

Here's what I've done. Stock HTC kernel, SetCPU to max, Skyraider 3.0 RC2.

screenshot.jpg


screenshot_1.jpg
 
Upvote 0
I agree. Just looking at the frame rates on Quadrant leads me to believe there's some trickery going on. Frame rates are nearly the exact same. Nenamark also shows no increase and is entirely 3D benchmarking. I'm not sure where we're seeing gains on Quadrant, but it's not in the 3D arena.

Here's what I've done. Stock HTC kernel, SetCPU to max, Skyraider 3.0 RC2.

http://img.photobucket.com/albums/v317/sabrewings/random%20stuff%2010/screenshot.jpg[/MG]

[IMG]http://img.photobucket.com/albums/v317/sabrewings/random%20stuff%2010/screenshot_1.jpg[/IG][/QUOTE]

3D is only one of 5 tests on quadrant. You're not going to see a 3d increase unless you overclock the CPU, and thus by association, the GPU. Allocating more ram to the GPU seems to help it out also. Look at my post above, the CPU is the biggest gain from froyo, from the JIT compiler and other optimizations.

True, there's not much gain in 3d, but I wouldn't call it trickery.
 
Upvote 0
Since we are looking at an aggregate score, it is all in the weight of each item measured. That alone can bias perception of a score (need to know the item weight). Still, not seeing how 10% clock increase can yield 30% or higher results.

I think a seperate operation and 3D score would provide a more clear indication of performance. Also, concurrent test runs by backing out and killing the app- fairly confident the tests are biased otherwise. I appreciate the paid version probably has item scores, but 99% of the people are using the free version. Just seeing the aggregate and running back to back while still in the app.

added:

Bias is not always trickery, but a lack of measuring procedures and standards :)

My scores haven't ever been 30% higher from a 10 or 15% increase? If you increase clock speed, 2d and 3d scores, as well as the cpu scores will increase though. I'm not sure if the processor scales linearly, though it seems like it.

Where do you believe the bias is coming from by running it several times in a row? I know it's not the memory or I/O or any of the other tests really, I've seen those scores vary between tests a small amount (up or down). When I use the interactive governor (if the kernel supports it), I barely see any variation between tests. I still think the CPU is scaling up because of the load put on it. So for at least part of the first time you run quadrant, the CPU is not running at full speed or capacity.


Regardless, it's easy to manipulate quadrant, and because of different reasons than you, I don't believe quadrant is a good measure of performance either. I think it needs an update.
 
Upvote 0
My scores haven't ever been 30% higher from a 10 or 15% increase? If you increase clock speed, 2d and 3d scores, as well as the cpu scores will increase though. I'm not sure if the processor scales linearly, though it seems like it.

Where do you believe the bias is coming from by running it several times in a row? I know it's not the memory or I/O or any of the other tests really, I've seen those scores vary between tests a small amount (up or down). When I use the interactive governor (if the kernel supports it), I barely see any variation between tests. I still think the CPU is scaling up because of the load put on it. So for at least part of the first time you run quadrant, the CPU is not running at full speed or capacity.


Regardless, it's easy to manipulate quadrant, and because of different reasons than you, I don't believe quadrant is a good measure of performance either. I think it needs an update.

I was hoping someone could tell me why they are higher running in a row. The "app has to catch UP" angle does not wash, since we are talking milliseconds for reaction times by the chipset for startup response and micoseconds for other functions.

When I test "fresh" I get consistent results, but if I do them with the same session, first one is lowest, second medium, third highest and fourth either is flat or a little lower. That is generally the trend I see.

Scores are all over the place for all devices- not just Inc. If we consider all the different stuff out there:

1. Kernels
2. Rom bakes
3. Radios
4. SetCPU

No wonder!

No rational way to define standards and I am not confident that Quadrant can take them all into account.
 
Upvote 0
Linpack really seems to be the only reliable way to quantify the speed of your phone. It just doesn't offer the pretty graph that Quadrant does.

I agree, I like Linpack much more. Especially since the recent upgrade, that made it more accurate. It's only one test though, vs the several that quadrant uses.

it's still pretty useless as a comparison though, because a lot of people still use the old version and can cheat and submit their scores from the old version on the website even though you're not supposed to be able to. Plus you can fake the build. If you notice on the website now, the Top 10 by device is all screwed up. The Nexus One list has mostly incredibles in it, and it looks like the top 3 Droid 2 devices are not droid 2's.
 
Upvote 0
I like the Inc (would love it if call quality was better) a lot, but NO WAY the Snap is going to outperform the OMAP 3630 (2.2 to 2.2). Yet, a lot of scores show this. Of course, the "stealth" Blur on the Droid 2 does not exactly help things, from a perception regard.


I think they're very close when it comes to performance on CPU alone. The Snapdragon is based on Arm7, but has certain enhancements over the usual variants based on that architecture, like a 128-bit wide SIMD. I could see it outperforming the OMAP processor on certain tasks, like a Linpack benchmark and probably other math heavy computations. The JIT compiler that's responsible for 2.2's huge performance increase, may be optimized for the snapdragon processors, being that google probably designed it with the snapdragon in mind (on a nexus one).

The OMAP processor in the droid X has a better GPU and you will see higher scores in 3d based benchmarks over a snapdragon phone.
 
Upvote 0
I was hoping someone could tell me why they are higher running in a row. The "app has to catch UP" angle does not wash, since we are talking milliseconds for reaction times by the chipset for startup response and micoseconds for other functions.

When I test "fresh" I get consistent results, but if I do them with the same session, first one is lowest, second medium, third highest and fourth either is flat or a little lower. That is generally the trend I see.

Scores are all over the place for all devices- not just Inc. If we consider all the different stuff out there:

1. Kernels
2. Rom bakes
3. Radios
4. SetCPU

No wonder!

No rational way to define standards and I am not confident that Quadrant can take them all into account.

Well, I don't see the repeated jumps in scores that you seem to. My second consecutive run of Quadrant matches with all others after it. All I have to do is ignore the first one and it works fairly well.

The fact that it does this, suggests something is cached. I really don't want to pay 3 bucks just to find out what specific score is increasing in Quadrant between the first and second run, but I suspect a combination such as 2d and 3d if it caches some of the textures.

As for any possible increase in performance being greater than the overclock percentage: I touched on it in an earlier post.

Perhaps the base code for the benchmark itself is statistically relevant? By which I mean, it is taking a noticeable percentage of processing for the base code where it handles/records all the data from the benchmark. This could cause a large leap in performance from a small increase in the actual speed. Yes...it would still be linear: but it would be greater than the increase in the clock speed.

I forgot to add that the Android system and other programs running in the background would factor in as well.

Lets take an extreme example, and say that android is taking up 50% of the CPUs power, with the base, non-test code of the program taking up 25%. This would leave only 25% ( or roughly 250mhz ) of the CPU to actually run the benchmark. You're running 2.2 so you get a score of 1,200. Now, you overclock by 10 percent, taking you to 1.1ghz. However, because Android and the Quadrants base code do not take any more of this, all 100mhz is able to be devoted to the actual test code of Quadrant, netting 350mhz ( a 40% increase ) so your new score would now show 1,680 when you were expecting 1,320.

NOTE: Yes, I made those numbers up and increased them way over the top to make it more clear what I'm talking about:)

This would only become apparent with multiple, large increases in the OC, and no other changes. You would notice that your score doesn't jump up as much as it did initially. IE: In the above example, if you then took it took 1.2ghz you would NOT see a 40% increase again. You would be getting 450mhz for the benchmark now, which is a little less than a 30% increase. So, it would then appear you are getting less and less for equal amounts of overclock.
 
Upvote 0

BEST TECH IN 2023

We've been tracking upcoming products and ranking the best tech since 2007. Thanks for trusting our opinion: we get rewarded through affiliate links that earn us a commission and we invite you to learn more about us.

Smartphones