Well I decided to revive my floppy attempt at a thread here.
")
This time hopefully I can bring a little bit more to offer. I ran 24 total bench marks, in 4 categories. All benchmarks were performed on the device in an unrooted state. No play store updates were ever made to preinstalled apps.
The categories that I ran benchmarks on were:
- fresh install with firmware c
- optimized install with firmware c
- fresh install with firmware d
- optimized install with firmware d
Since the phone tests were done on an unrooted phone, I use the word "optimized" to mean all system apps were disabled except for the following:
Download Manager
Downloads
Google Account Manager
Google Services Framework
QuickMemo
To average out abnormalities, multiple benchmarks were run on each category.
3 benchmarks on each category using Quadrant Standard
3 benchmarks on each category using AnTuTu Benchmark
Note: If it is not obvious, I/O benchmarks will be disregarded because that score is much more dependent on the sdcard we have purchased rather than the phone itself.
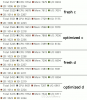
Code:
Higher Numbers are Better
Quadrant Fresh firmware c
tot cpu + tot mem + tot 2d + tot 3d = total
29035 + 23020 + 3026 + 6664 = 61745
Quadrant Optimized firmware c
tot cpu + tot mem + tot 2d + tot 3d = total
28681 + 23235 + 3060 + 6669 = 61645
Quadrant Fresh firmware d
tot cpu + tot mem + tot 2d + tot 3d = total
29149 + 22198 + 3051 + 6706 = 61104
Quadrant Optimized firmware d
tot cpu + tot mem + tot 2d + tot 3d = total
28946 + 22145 + 3060 + 6667 = 60818
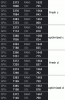
Higher Numbers are Better
AnTuTu Fresh firmware c
tot cpu + tot ram + tot gpu = total
10134 + 4958 + 21317 = 36409
AnTuTu Optimized firmware d
tot cpu + tot ram + tot gpu = total
10124 + 4961 + 21418 = 36503
AnTuTu Fresh firmware c
tot cpu + tot ram + tot gpu = total
10112 + 4972 + 21744 = 36828
AnTuTu Optimized firmware d
tot cpu + tot ram + tot gpu = total
10140 + 4991 + 21409 = 36540